How To Debug Web Service In Client Application
Once you've closed your Web browser to end the browser debugging session, you can use the TimeServerClient application in the TimeServer solution to investigate debugging a Web service with a SOAP-based client. To do this, you should start by using Visual Studio's Solution Explorer to go to the solution's Properties ' Common Properties ' Startup Project property page and select the Multiple Startup Projects option. Make sure on this property page that the start actions of the TimeServer and TimeServerClient projects are both set to Start. This means that you're going to start the debugging session with the client application and the Web service will be started when first invoked by the client.
On the TimeServer project's Properties ' Configuration Properties ' Debugging property page, change the Start Action option to "Wait for an external process to connect," as discussed previously in the "Debugging Preparation" section. This specifies that the Web service will be started and debugged as soon as it's called by the client application. As before, on the same page check that the ASP .NET debugging option is selected.
Before you start the application, you should add a breakpoint on line 118 of the ClientForm.vb class. This is the line of code in the client application that invokes the CurrentTime Web service method when the GetTime command button is clicked. While you're in this method, take a quick look at the code in the form's Load event. After creating the Web service proxy, it sets the proxy timeout to ˆ' 1. This line of code prevents any Web method call from ever timing out. Without this, if you spend any significant time debugging a Web service call, you will see a time-out error that throws you back into the proxy method and you'll be unable to continue debugging. When you release your Web service client into production, you should ensure that this line of code is removed.
'Create web service instance (via proxy) and 'ensure timeout never happens during debugging m_TimeTest = New localhost.TimeService #If DEBUG Then m_TimeTest.Timeout = -1 #End If
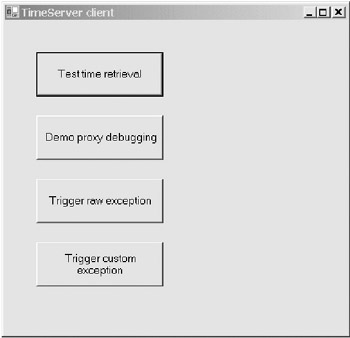
Now start the TimeServer solution from Visual Studio by pressing F5. This should launch the client's user interface that allows you to call into the Web service. Figure 8-3 shows this interface.

Figure 8-3: User interface for testing the TimeServer Web service methods
The first command button, Test time retrieval, calls the Web method CurrentTime , which returns exactly that. The second command button, Demo proxy debugging, calls ThrowExceptionRaw and will come in handy later for demonstrating proxy debugging. The third command button, Trigger raw exception, also calls ThrowExceptionRaw , but this time to demonstrate how a Web service translates a specific exception into a rather meaningless generic exception. The final command button, Trigger custom exception, calls the Web method ThrowExceptionCustom and demonstrates how a useful exception can be produced from within a Web service.
Clicking the Test time retrieval command button should trigger the breakpoint that you've just set. From here, you can step into the Web service and then back to the client form before the result returned by the Web service method is printed on the label to the right of the command button. While you're stepping through the Web service you have access to all of the normal debugging windows and other facilities.
You may notice that the first time a method is called on a Web service during a debugging session, the response is rather slow. Unfortunately, there's rather a lot of machinery sitting between (and inside) the client and the Web service, and this machinery needs to be cranked up for debugging. Further calls are executed much faster than the first call. If you set the debug attribute in Web.config to false and start the solution without debugging (by pressing Ctrl+F5 rather than F5, if you use the standard keystrokes), everything will run considerably faster.
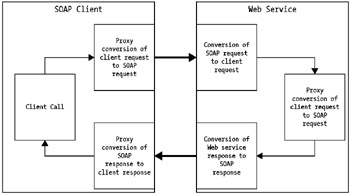
Some of the machinery that is being concealed from you to facilitate the process of calling a Web service is actually useful to know from a debugging point of view. Figure 8-4 shows the normal interactions between a Web service and a typical SOAP client. Even a brief examination of this diagram shows you that there's more going on here than the debugger is showing you by default.

Figure 8-4: Interactions between a Web service and a SOAP client
Leaving some of the exact message serialization details for later, this is what happens when a Web service interacts with a client of that Web service using SOAP:
-
The client makes a call to a proxy class method.
-
The proxy method translates the call into a SOAP request message.
-
The SOAP request is sent over the network to the Web server.
-
The SOAP request is translated back into a .NET call.
-
The Web method receives the client's call.
-
The Web method processes the call and returns a result.
-
The .NET result is translated into a SOAP response message.
-
The SOAP response is sent over the network to the client proxy.
-
The SOAP response is translated into .NET result by the proxy method.
-
The client receives the .NET result from the proxy method.
The next section shows you more about what's under the hood by looking at how to debug the client proxy class that sits between the client and the Web service and is responsible for processing the SOAP request and response messages on the client side. Knowledge of this proxy class can be useful for debugging many Web service issues.
How To Debug Web Service In Client Application
Source: https://flylib.com/books/en/4.228.1.69/1/
Posted by: lopezhithatides88.blogspot.com

0 Response to "How To Debug Web Service In Client Application"
Post a Comment